

A few months ago I wrote about the importance of differentiation in the classroom. It was identified that, by providing teaching staff with a wide spectrum of details about a student, then learning could become more meaningful. Since that discussion, my colleagues and I agreed that a Personal Learning Card, available about each student in the school, should be a priority. This finely curated digital card would give teachers an ‘at a glance’ overview of a learner.
In this article I will cover how you can collect this data, display it, and more importantly show how it can be accessed and processed by your teaching colleagues.
Personal Learning Cards
A Personal Learning Card is a singular location that houses details concerning a student. I chose to start with the ideal outcome of the project: what information needs to be included, and how should it be displayed?
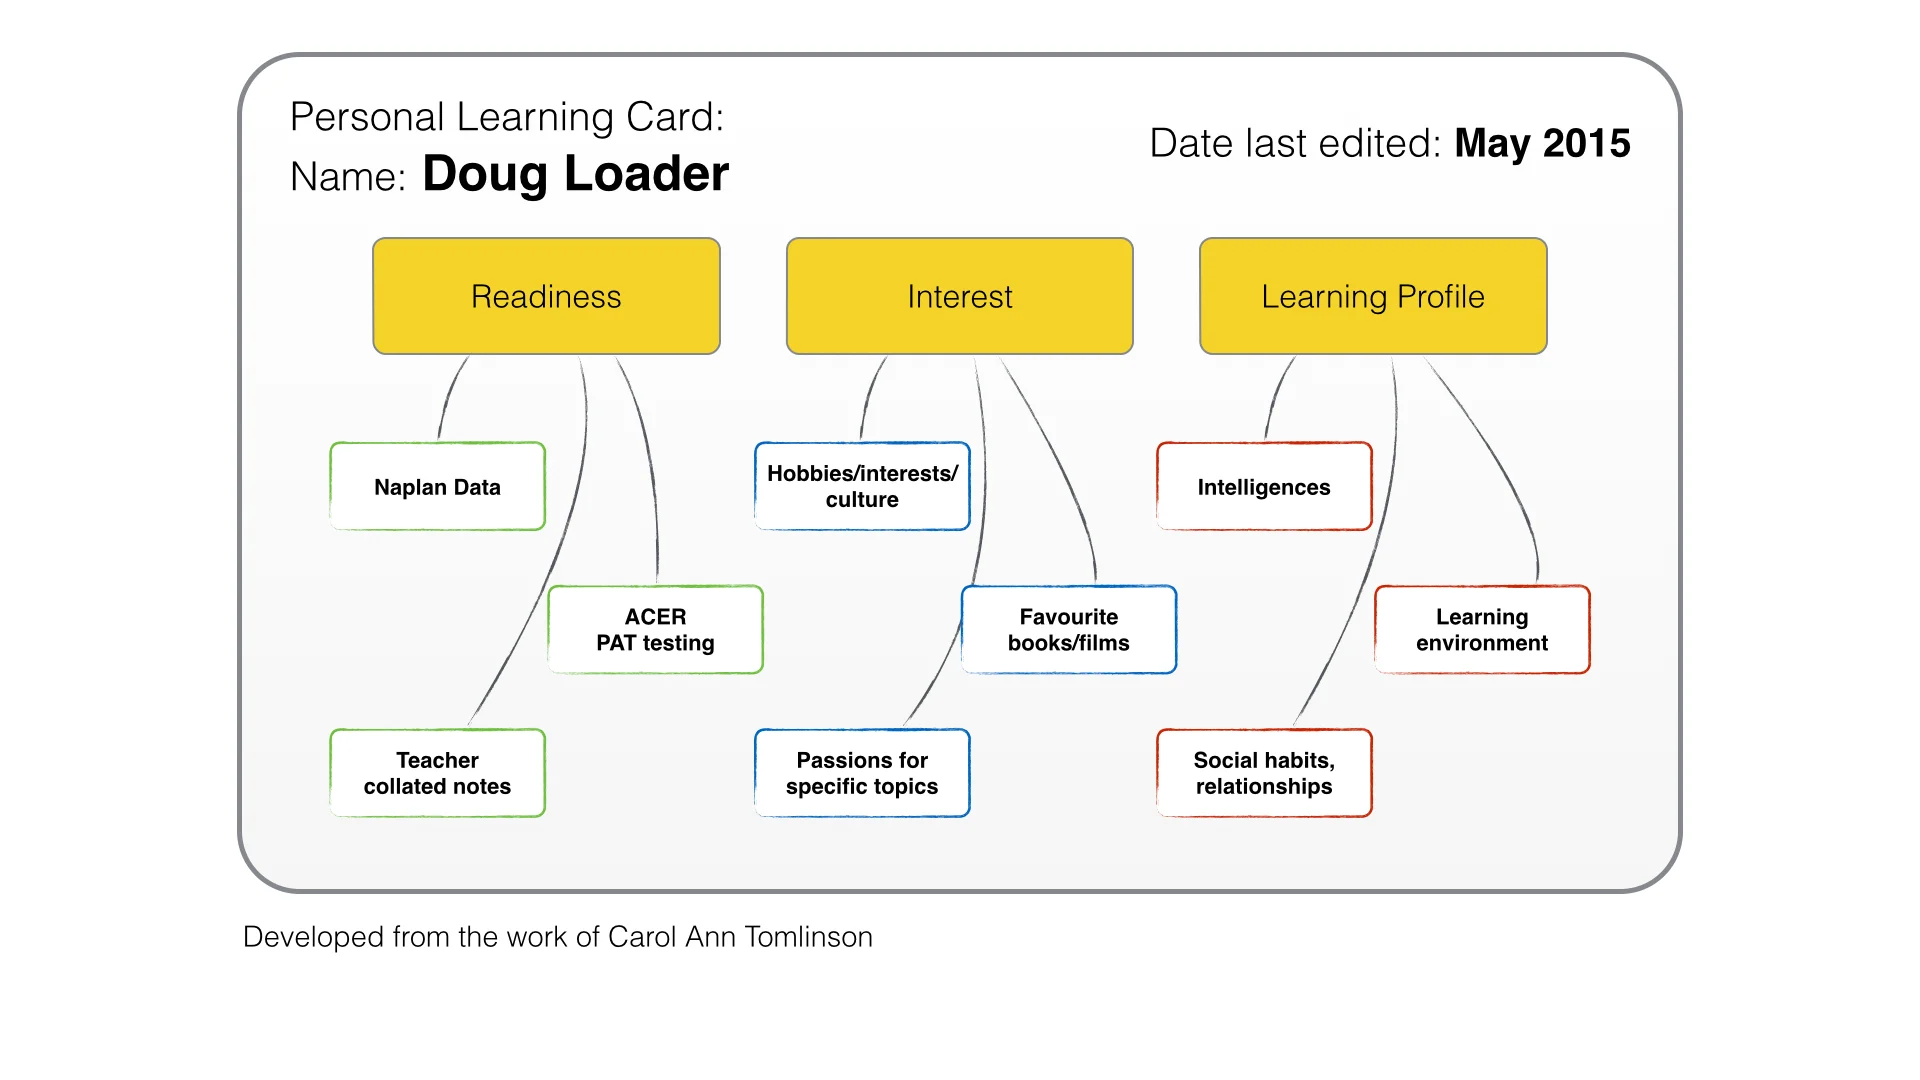
This diagram illustrates how I envisioned the information that the learning card would contain. I have started with Tomlinson’s three suggested categories that vary a student, they are: Readiness, Interest and Learning Profile. The field of Readiness can be achieved through a combination of official testing such as NAPLAN results, but also individual teacher surveying and notes throughout the year. In my school's case we have been using ACER's PAT testing, it is this type of data that will provide teachers with a starting point to understanding a student's Readiness.
The two remaining fields of Interest and Learning Profile are something which can be ascertained by way of a survey or quiz to be taken periodically, for example at the beginning of each year.
As a result of Tomlinson’s work I developed a survey using Google Forms, which was split into three different sections, developed to ascertain the following:
- Interests: including favourite subject and least favourite subject at school. Aspirations: what the student hopes to become; who the student admires. Media influences: favourite TV shows and websites.
- Self-perception: how a student would describe himself or herself.
Results from a multiple intelligence test (questions were derived from a reputable online source) would also be included, providing a teacher some insight into a student’s preferred learning style.
- Kinaesthetic – Body Smart
- Linguistic – Word Smart
- Logical – Number Smart
- Interpersonal – People Smart
- Intrapersonal – Myself Smart
- Musical – Music Smart
- Visual/Spatial – Picture Smart
- Naturalistic – Nature Smart
- After some deliberation it was decided that Naturalistic intelligence would be removed. This would not be applicable for the staff at our school.
- I also chose to include details about a student’s preferred learning environment, and how they function in different social situations.
The results of the Google Form come through in a spreadsheet, 1 student per row. By creating new sheets nested in the spreadsheet, I could begin to sort the data, 1 sheet for each student.
Making the data accessible

In order for any of the information to be useful it needs to be presented in a visual manner, so that a teacher can quickly reference and process it. The intelligence test data is displayed as a pie chart, so it is easy to establish the domineering intelligences.
The text based answers concerning interests and aspirations are probably the most revealing about a student. These are displayed simply in clear red text.
The most challenging formula to write into the spreadsheet was the one which reveals the learning and social environments of a student. Depending on the answers of 28 questions a student can have one of four outcomes for each category.
For example the outcome “I like to learn…” will result in an output of either:
- “In a group where I’m lead”
- “In a group where I’m the leader”
- “Independently”
- “Independently with some direction from a teacher or friend.”
In practice
The advantages of a Google Form is that I do not require each student to leave their name, we already know who they are because they are logged into their instance of Chrome on their device. Each student can spend as much time as they need on the survey and once they click ‘submit’ the answers are all collated for me. This may be dozens or even hundreds of results. The data is then processed in a largely automated fashion. The result is a webpage for each student that hosts their very own Personal Learning Card.
Google Forms and Sheets is an incredibly powerful tool, but the real benefit is in the option: ‘Publish to the web…’, here lies the redefining aspect of the GAFE suite, enabling us to create a webpage of finely tailored information (including graphs, charts and tables) for every single student.
Make no mistake; the information provided is nothing more than a tiny slice of information that a teacher may take into consideration. It is by no means a method by which we pigeon hole students. Probably the most rewarding part of this process is that all staff will begin to reference some of the same terminologies (Readiness, Learning Profile etc), and all are starting to think about differentiated instruction.